
Hive Scale - Computers and Beekeeping
This all started at the Georgia Beekeepers meeting in February 2012. Paul Vonk was the last speaker with the best presentation. Paul talked about setting a hive on a scale with temperature sensors inside and outside the hive. Every five minutes a computer records the weight and temperatures. The data is stored on a server and is used to create a graph that is accessed via the internet.
So.... you're wondering what's the deal with putting a hive on a scale?????
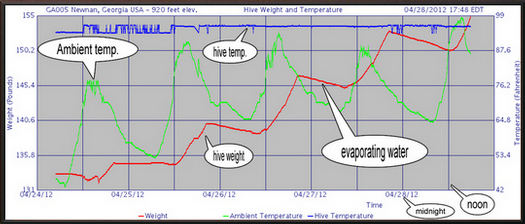
I can tell when the bees leave the hive and when they all get back home at the end of the day. I can tell when the nectar flow starts and when it ends. Right now the nectar flow is strong. The bees are bringing in 6-10 pounds of nectar a day. From sunset to about noontime the next day the bees are evaporating water out of the nectar. Notice how the line each night has the same downward trend. Sometime in May the nectar flow will taper off and end. I'll be able to tell when that happens. Once the nectar flow ends they will not make any more honey and I can harvest what's available.
I check the website multiple times a day to see what's happening.
See the graph below to understand what everything means.
Red - weight
Green- outside air temperature.
Blue - Temperature in the brood area of the hive
Thanks to Scott Griggs for all the help setting up the computer. Thanks to Paul Vonk for getting this whole program up and running.
Let me know if you want a hive scale also.................
Below is a photo of the hive setting on the scale...

—————
Contact
Steve Page180 Barrington Grange Dr.
Sharpsburg, GA 30277